Time to Control Risk: UUP, TBT, TLT, DIA
In addition, as difficult as this environment has been to short, I have not been more confident in my short positions for a long time. We have shorted, stopped, let the market move higher, shorted, stopped, let the market move higher, reentered, and were stopped again repeatedly over the past few weeks. The technicals, Fibonacci levels, timing models, nothing really seemed to work during this process because everything was predicated on the weakening dollar. The dollar was the only game in town, and Wall Street could care less about anything else besides which direction the dollar was going. If the dollar indeed has stopped its decline, and if the market has been following the dollar and it continues to do so, I expect the market to weaken based on that premise alone.
However, and more importantly, longer-term resistance has also been successfully tested in the Dow Jones industrial average. Review 12 the month chart of DIA (NYSE: DIA) for details (available for members). That is a major technical test and not something that the market can easily shrug off. Yes, the market can break above longer-term resistance levels, but this is not insignificant like other technical parameters may have been considered. This one is a big one. In addition, the test of technical resistance came after a break above Fibonacci retracement levels.
Reversal dojis also exist in the longer-term charts which can easily convert into grave stone dojis if the market declines on Friday. This too would be a potentially bearish indicator not only for next week but it could set the stage for the next handful of weeks given the test of longer-term resistance that coincides with these developing dojis. Pay very close attention to market action on Friday.
Additionally, and quite negative for all companies who rely on international trade to drive their business, a discussion of trade sanctions is now on the table. Not only is there a currency war, but the global economy is starting to throw punches no one is ready for. Everyone has thought buying the companies who generate significant revenues overseas was the best idea. What if a line is drawn in the sand? Could we be forced to raise rates and let the dollar increase?
This is all happening at a time when financial stocks are likely to be decimated if the small snowball that exists now begins to roll downhill. Put backs are like returns after Christmas. Do they really have a no refund policy?
Between probable dollar strength, existing currency wars, potential trade wars, tests of longer-term resistance in the Dow, and extremely high risks in the financial sector, not to mention the austerity measures and higher taxes we will face in the near future, the ducks are lined up.
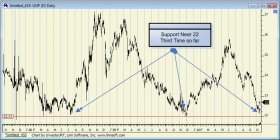
Support and Resistance Plot Chart for
Blue = Current Price
Red = Resistance
Green = Support
Real Time Updates for Repeat Institutional Readers:
Factset: Request User/Pass
Bloomberg, Reuters, Refinitiv, Zacks, or IB users: Access Here.
Our Market Crash Leading Indicator is Evitar Corte.
Evitar Corte warned of market crash risk four times since 2000.
It identified the Internet Debacle before it happened.
It identified the Credit Crisis before it happened.
It identified the Corona Crash too.
See what Evitar Corte is Saying Now.
Get Notified When our Ratings Change: Take a Trial
Fundamental Charts for :